The final stretch of this series is about evaluation: knowing whether your agent is any good. That starts one step earlier, with being able to see what the agent did at all.
Observability is the data you collect while the agent runs. Without it, an agent is a black box that either gave a good answer or a bad one, with nothing in between to learn from. With it, you can see the whole path, find where a run went wrong, and measure whether a change helped.
Three kinds of signal
Observability rests on three complementary types of telemetry, and each answers a different question.
Metrics: numbers over time. How long did each tool call take? What was the total task-completion time? How many steps did a run use, and what did it cost? Metrics are small numerical measurements you can collect cheaply at scale and watch on a dashboard. They tell you how much and how fast, in aggregate.
Traces: the path of one run. A trace is the ordered record of everything that happened in a single execution: the model calls, the tool calls and their arguments, the results, the final answer, each timed and linked. A trace is one run's whole story, start to finish.
Logs: the detail at each step. Logs are the specific events and messages: this tool returned this, this error occurred here, this decision was made. Where a trace is the skeleton, logs are the detail on each bone.
| Signal | Answers | Shape | Best for |
|---|---|---|---|
| Metrics | How much, how fast, in aggregate | Numbers over time | Dashboards, trends, alerts |
| Traces | What path did this one run take | One run, ordered and timed | Debugging a specific execution |
| Logs | What exactly happened at this step | Individual events | The detail behind a step |
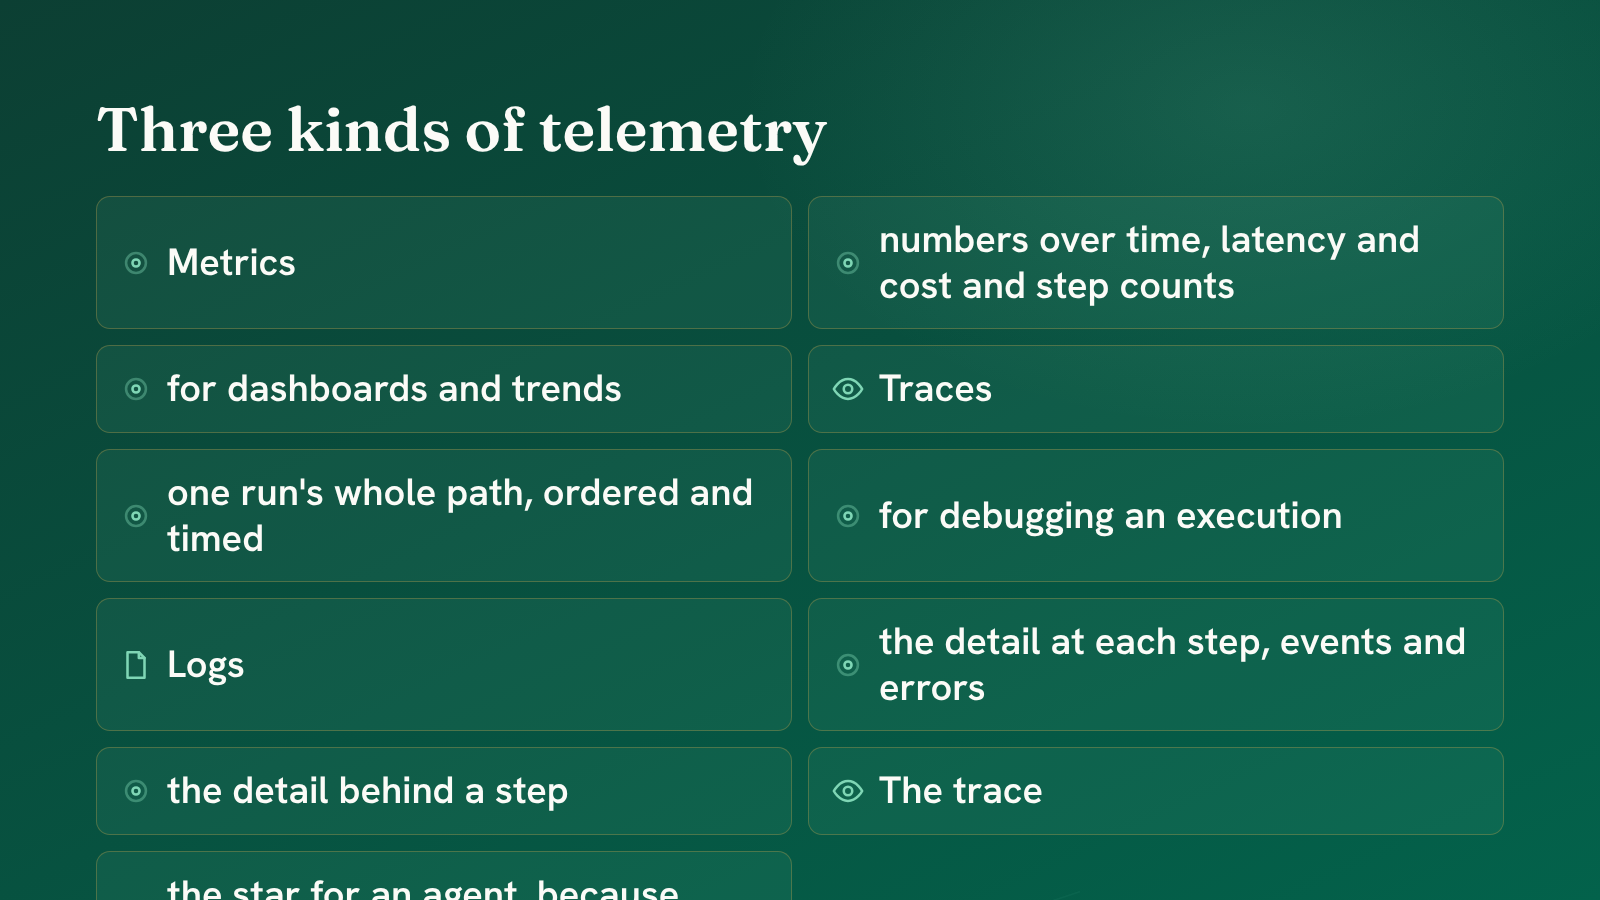 Metrics aggregate, a trace follows one run, logs hold the detail at each step.
Why the trace matters most for an agent
For a traditional program, metrics and logs carry most of the weight. For an agent, the trace is the star, and the reason goes back to what an agent is.
An agent's behaviour is a trajectory: reason, call a tool, read the result, reason again, for as many steps as the task takes. Whether the agent is good depends on more than the final answer. It rests on whether it took a sensible path to get there, or whether it wandered, repeated itself, called the wrong tool, and stumbled onto a right-looking answer by luck.
The trace is the only thing that shows you the path. A metric tells you a run took twelve steps; the trace tells you that eight of them were the same failing search repeated. Evaluation of an agent, which the next posts build, is largely evaluation of traces, so capturing them well is the foundation.
Capturing telemetry: OpenTelemetry
You do not want a bespoke logging scheme for every agent. Telemetry has a standard, OpenTelemetry, which defines a common way to generate, collect and export all three signal types, so your traces and metrics can flow to whatever backend you use to view them.
The idea is instrumentation: you wrap the agent's key operations so each one emits telemetry as it runs.
# instrument the parts of the agent you want to see
with tracer.start_span("tool_call") as span:
    span.set_attribute("tool.name", call.name)
    span.set_attribute("tool.arguments", str(call.arguments))
    result = await execute_tool(call)
    span.set_attribute("tool.result_size", len(str(result)))
Each span is one operation in the trace, tagged with attributes you care about, the tool's name, its arguments, the size of its result. Collected across a run, the spans reconstruct the whole trajectory. Using the standard means the data drops into existing observability tools rather than a homegrown viewer, which is worth it once you have more than a toy.
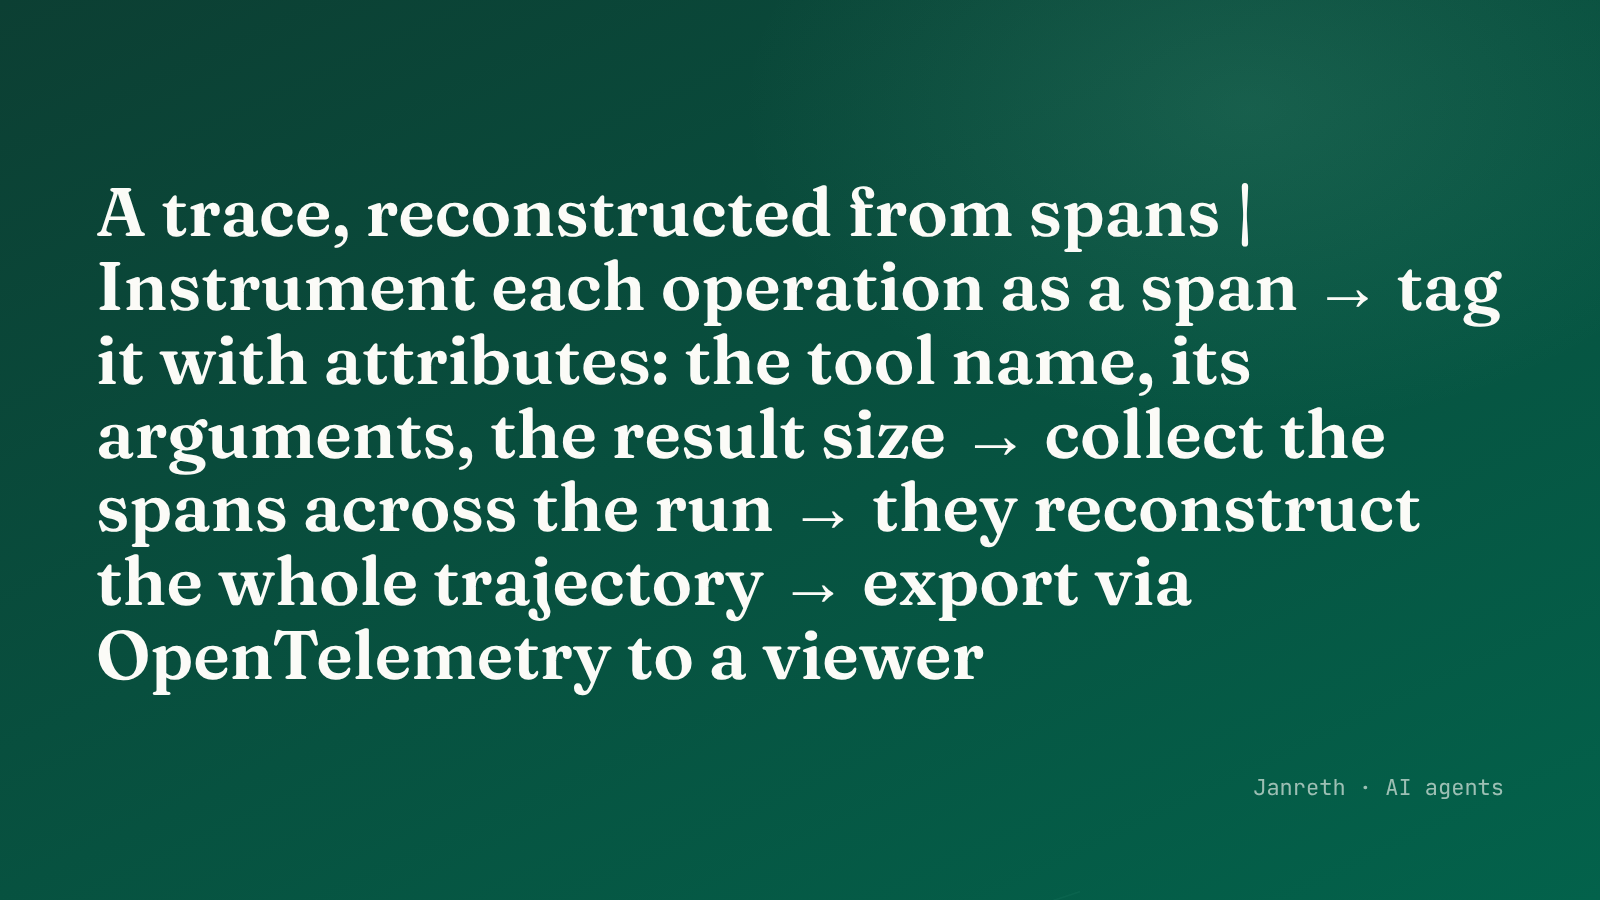 Instrument each operation as a span; collected across a run, the spans reconstruct the trajectory.
What to take from this
- Observability is the data you collect while the agent runs, and it is what turns a black-box agent into one you can debug and measure.
- Three signals cover it: metrics (numbers over time), traces (the path of one run), and logs (the detail at each step).
- The trace matters most for an agent, because an agent's quality is its trajectory, not just its final answer. Evaluation is largely evaluation of traces, so capture them well, with a standard like OpenTelemetry.
Seeing what the agent did is step one. Deciding whether what it did was good is a separate, harder question, and it needs more than "was the final answer right". The next post is about what to actually evaluate.